 ecbyts
Updated
ecbyts reaches 100 registered users and 4 published courses
About 4 min read
- Guide
- Audio
The count includes only real registrations, with no test accounts, and brings together professionals, researchers and students on an open platform for environmental, occupational and engineering data.
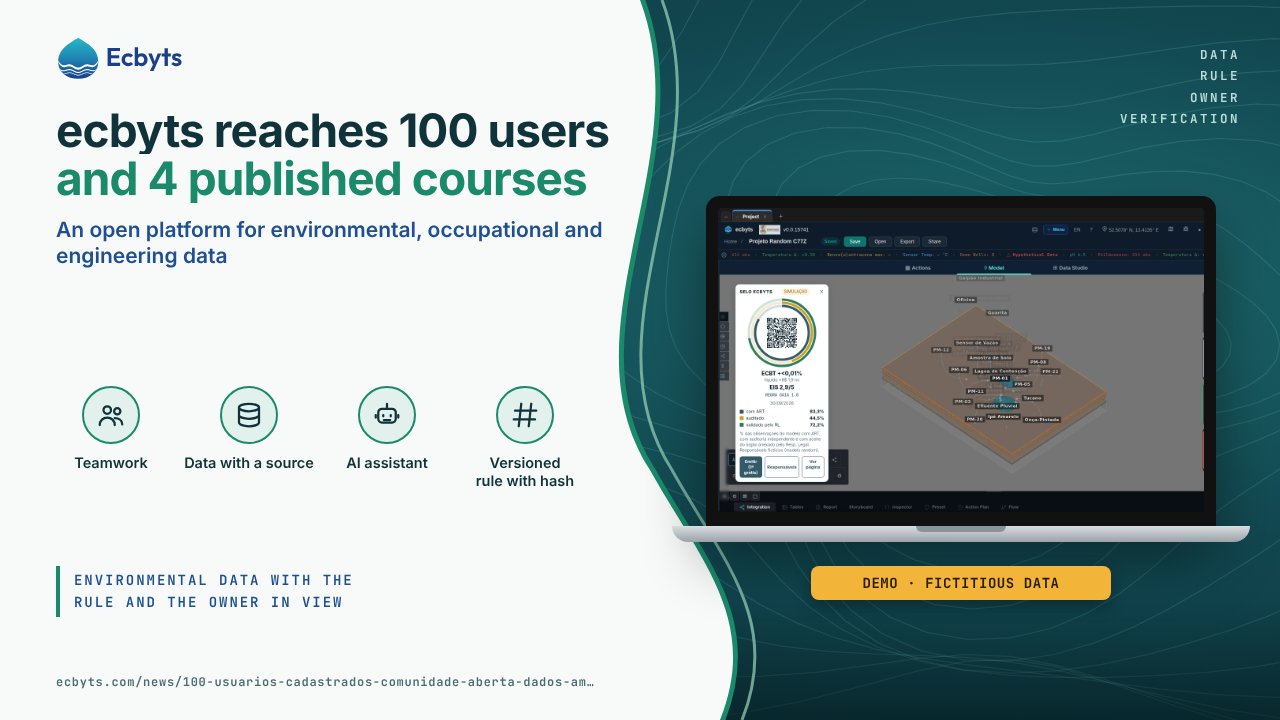
On November 8, 2026, the ecbyts community panel recorded 100 registered users, in a count that leaves out internal test accounts, and the first 4 published courses on the platform. ecbyts is an open source platform, available under the GNU AGPL-3.0 license, for organizing environmental, health and safety, and engineering data. This article sums up what the milestone shows, what the platform already offers and how to take part.
What the 100-user milestone shows
The first 100 registrations arrived organically. The project was born with the purpose of raising the level of digitalization in engineering and in environmental, health and safety management. The milestone shows that there is room for an open platform in which technical rigor and collaboration go hand in hand.
In day-to-day technical projects, monitoring data often ends up scattered across isolated spreadsheets, static reports and files that are hard to update. This is the problem that brings professionals, researchers and students together on the platform.
How ecbyts solves it
ecbyts reproduces the characteristics of a real environment (an industrial plant, a rural area, a river basin or a municipality) in a single integrated workspace. The platform receives and organizes information of any kind: soil and water quality, air emissions, greenhouse gases, biological indicators, occupational health data, project schedules and financial parameters.
Every piece of information follows the same logic: the location of the point, the date and time of the measurement, the parameter analyzed, the value read and the unit of measurement. When an indicator changes in the monitored environment, the update appears in the platform's panels and three-dimensional models.
The interface also shows the origin and the reliability of each piece of information. If a sample was collected outside good practice, or if there are elements without coordinates in the project, the screen flags the pending issue and presents the degree of confidence and uncertainty of the data. Three features support this design:
- End-to-end traceable flow: the person responsible for field collection records the raw data, the technical lead conducts the analysis and the modeling, and stakeholders or regulatory agencies view the validated data, with the history preserved against retroactive changes.
- Artificial intelligence with human oversight: the AI assistant helps you query data in natural language, carry out tasks in the workspace and draft technical texts. The platform identifies what was generated or changed by artificial intelligence and what was validated by a professional.
- Unified work environment: in the same window, you switch between the Actions panel (with automatic project review alerts), the spatial view of the Model and the Data Studio, for database queries, statistical analyses and simulations.
In practice
Anyone who opens the platform today finds two active fronts in the Community & Marketplace panel:
- 4 published courses: practical training content, available inside the platform, to support students and professionals in using the data management and analysis tools.
- Space for publishing tools: any user can create and make available tools, tables, models, reports or calculation routines through the Publish your tool button, free of charge for the whole technical community or as a specialized solution and service in the Marketplace.
What this feature is not
ecbyts does not replace the judgment of the engineer or the scientist: it gives these professionals an open, auditable and up-to-date base to work on.
- It does not treat what the AI generated as validated: content generated or changed by artificial intelligence stays identified, separate from what a professional validated.
- It does not hide gaps: when collection departs from good practice or coordinates are missing, the interface shows the pending issue and the degree of uncertainty.
- It does not count test accounts: the 100 users are real registrations.
How to practice
The work environment is at ecbyts.com, and the courses are in the Training catalog. To publish a course or a tool, use the Publish your tool button in the Community & Marketplace panel.
ecbyts thanks each of the first 100 people who created an account, tested models, published courses and helped make the management of environmental and operational data more transparent and accessible.