 ecbyts
Updated
See soil carbon, aluminium and compaction at depth
About 3 min read
- Guide
- Audio
- Tour
The tour reads a soil spreadsheet with 4 layers and 3 crop seasons through the import wizard, without saving anything to the model. Fictitious data.
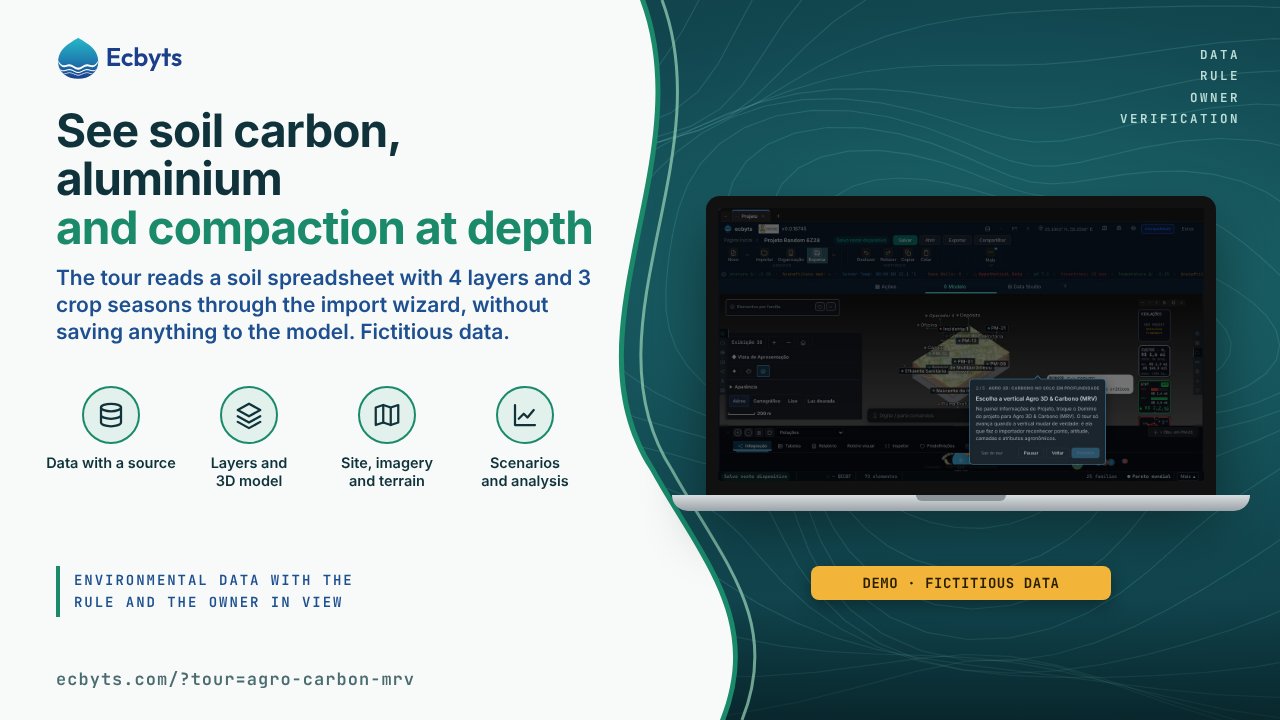
Precision agriculture usually treats the field as a 0 to 20 cm carpet, but roots, chemical barriers and the carbon stock live at depth. The Agro 3D: soil carbon in depth tour shows how layered lab reports enter ecbyts and what they reveal down to 1 m. To practice you only need a browser and the demo model: the sample spreadsheet uses fictitious data, no account is required and nothing is saved to your model.
What the tour shows, step by step
- The soil beyond 20 centimeters. The tour presents the synthetic spreadsheet, with 9 points (PT-01 to PT-09) in 4 layers down to 1 m and 3 crop seasons (2024, 2025 and 2026), and highlights the Import button, where lab reports enter the platform. Each row carries total organic carbon, base saturation, aluminium saturation or penetration resistance.
- Choose the Agro 3D & Carbono (MRV) vertical. In the Project Information panel, you switch the Project domain to Agro 3D & Carbono (MRV). The tour only moves on when the vertical actually changes, because it is the vertical that teaches the importer to recognize the columns ponto, altitude, prof_ini, prof_fim, atributo and valor.
- The soil report, already understood. The import wizard reads the sample CSV and recognizes the columns without manual setup: ponto becomes the location, prof_ini and prof_fim become the agronomic layer, atributo and valor become the indicator and its content. Nothing is saved to the model.
- Carbon, aluminium and compaction at depth. In the sample data, organic carbon at PT-01 rises from 18.5 to 32.4 g/kg over three seasons, while the southeast of the field (PT-06, PT-08 and PT-09) shows aluminium saturation above 40 % and compaction above 2.5 MPa. At PT-09, the conventional-management control, carbon falls from 14.8 to 13.5 g/kg. In a real import, these layers form the 3D bulb, and the carbon stock in tCO2e is computed from soil volume, bulk density and the 44/12 factor.
- Importing is your move. The tour closes the wizard without saving. To work with your own fields, download the sample spreadsheet from the Domains group of the wizard, adjust the agronomic targets in the reference limits file and import it through the same route.
What this tour is not
The exercise neither imports nor saves anything: the wizard closes without ingesting data, and your model stays as it was. The carbon stock in tCO2e is an estimate computed on your data; it does not count as validation of carbon credits or additionality, nor as an agronomic report. The ECBYTS Seal records the integrity of the calculation and of the source data, with the limits of the verification stated on the public page, and it validates neither stock nor credits. The points, layers and agronomic targets in the limits file are fictitious and illustrative.
How to practice
Open the tour. The walkthrough takes about 3 minutes and requires no sign-up. The sample spreadsheet and the reference limits file are in the Domains group of the import wizard, for you to adapt to your own situation.