 ecbyts
Updated
Take SPT boreholes and piezometers from a spreadsheet to 3D
About 3 min read
- Guide
- Audio
- Tour
The tour reads a spreadsheet of 6 boreholes and 3 piezometers through the import wizard and shows the soft clay lens and the rising pore pressure. Fictitious data.
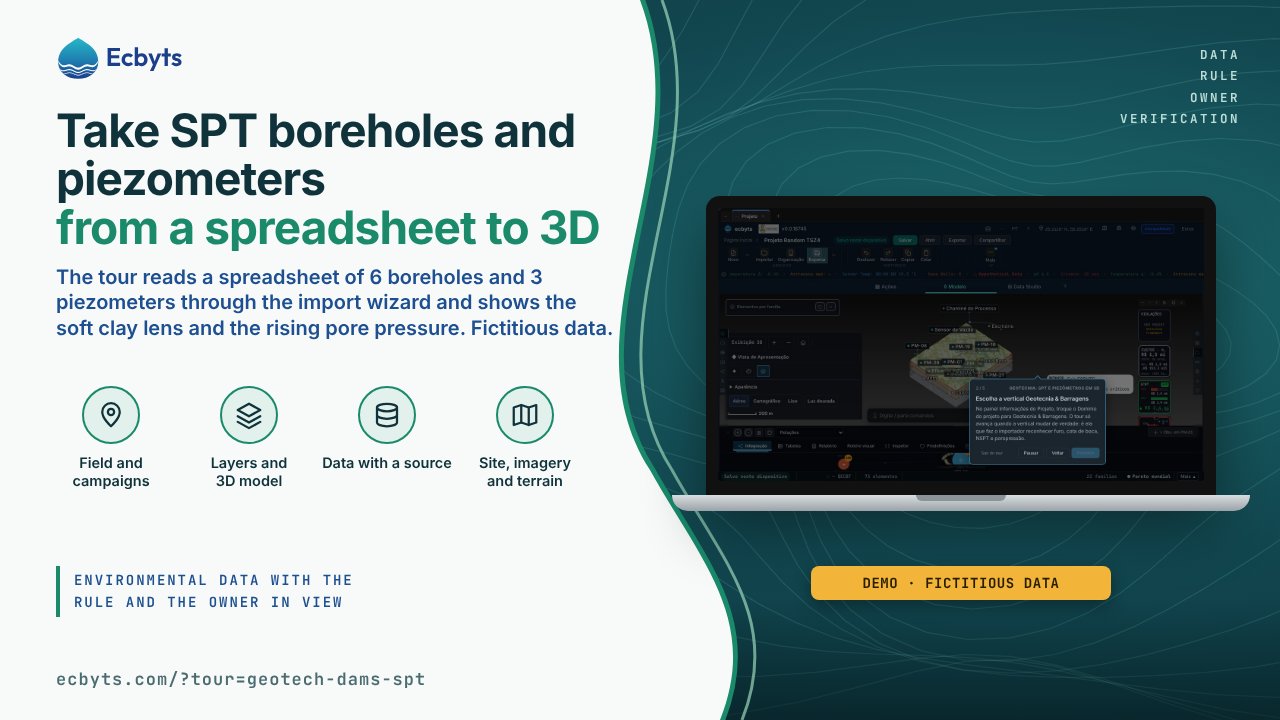
Anyone working on slope and dam stability knows the problem: borehole logs in PDF, piezometer readings scattered across spreadsheets and cross sections that take days to leave the CAD. The Geotechnics: SPT and piezometers in 3D tour shows the path of those data inside ecbyts, from the import wizard to what they reveal in 3D. To practice you only need a browser and the demo model: the sample spreadsheet uses fictitious data, no account is required and nothing is saved to your model.
What the tour shows, step by step
- From the borehole to the 3D model. The tour presents the synthetic spreadsheet, with 6 SPT boreholes (SP-01 to SP-06; SPT is the standard penetration test) and 3 piezometers (PZ-01 to PZ-03) over four campaigns between 2025 and 2026, and highlights the Import button, the same import wizard used in real work.
- Choose the Geotecnia & Barragens vertical. In the Project Information panel, you switch the Project domain to Geotecnia & Barragens. The tour only moves on when the vertical actually changes, because it is the vertical that teaches the importer to recognize borehole, collar elevation, N-SPT (the blow count of the test) and pore pressure.
- The raw spreadsheet, already understood. The import wizard reads the sample CSV and recognizes the columns without manual setup: furo becomes the point, cota_boca becomes the elevation, prof_ini and prof_fim become the interval, variavel and leitura become the test and its value. Nothing is saved to the model.
- What these data reveal in 3D. In the sample data, SP-02 and SP-05 have N-SPT between 2 and 4 blows from 6 to 12 m, a soft clay lens, and at SP-05 the RQD (rock quality designation) drops to 42 %, more fractured rock. Piezometer PZ-02 rises from 58 to 118.5 kPa over four campaigns, crossing the 110 kPa alert level used in the demo. In a real import, these series feed the 3D isosurface and the Mann-Kendall trend chart.
- Importing is your move. The tour closes the wizard without saving. To work with your own data, download the sample spreadsheet from the Domains group of the wizard, adjust the attention and alert limits of your structure in the reference file of the vertical and import it through the same route.
What this tour is not
The exercise neither imports nor saves anything: the wizard closes without ingesting data, and your model stays as it was. Attention and alert limits are set by you, in the reference file of the vertical; the 110 kPa value in the demo is illustrative. The ECBYTS Seal records the integrity of what you generate, with the limits of the verification stated on the public page, and it replaces neither the technical responsibility for the project nor a stability analysis by a qualified professional. The sample boreholes, piezometers and readings are fictitious, with their synthetic provenance described in the README that accompanies the file.
How to practice
Open the tour. The walkthrough takes about 3 minutes and requires no sign-up. The sample spreadsheet, the reference limits file and the README are in the Domains group of the import wizard.