 ecbyts
What an Environmental Digital Twin Is (and How ecbyts Makes It Practical)
About 12 min read
- Guide
- Tour
A map, a technical drawing and a spreadsheet are photographs: they are outdated by the next morning. An Environmental Digital Twin is alive — it brings together terrain, wells, soil types, contamination patches and legal limits, and redoes the maths with every new data point.
Imagine taking care of the health of a piece of land (or of a factory) by looking only at old photographs kept in different drawers. One photo shows the yard in 2022, another shows the same yard in 2024, and neither shows what happened yesterday. The results spreadsheet and the lab PDF are exactly those frozen photographs: each one shows what was known at the moment it was saved, no more, no less. The next morning a new water or soil test arrives, and the old photo no longer counts. That is where the confusion starts: the same site ends up with five versions of the truth, one per file, and nobody knows which one still applies.
The frozen photograph and the living twin
Maps, technical drawings and spreadsheets store shape and number very well. What they lose are precisely the three things that decide an environmental project:
- where each number came from: which field campaign, which well, which laboratory, which date, which method;
- what changed since the last reading, and in which direction;
- what the law requires at that exact point on the ground.
An Environmental Digital Twin is a living representation of a real site: the land itself, the monitoring wells, the types of soil and rock beneath the surface, the contamination patches in three dimensions, the sampling campaigns over time, the history of each point and the legal limits that apply there. The word "living" is not a marketing flourish. It means the model has memory, every piece of information carries its date, and everything is recalculated when new data arrives.
The difference shows up in the question you can ask the model. With a folder of files, the only possible question is "where was the lead value in that campaign?". With a model that has memory, the question is "how did the contamination patch change between the 2022 campaign and the 2026 one, and which points crossed the limit that forces an investigation?". The first question returns a number. The second returns a decision.
The three levels: model, shadow and twin
The technical literature does not use the phrase "digital twin" for everything. It separates three levels, and what distinguishes them is how the model connects to the real world:
- The frozen scale model (digital model). A carefully built drawing or register, with the shape of the site and the last known measurement. But it does not change on its own: if nobody updates it by hand, it ages just like the spreadsheet. It is there to be consulted, not to keep up with reality.
- The living model fed by each field visit (digital shadow). Here the path runs one way: each new measurement taken on site enters the model and the model recalculates. A well is resampled, the lab result arrives, the 3D map updates and starts showing how the patch moved from 2022 to 2026 and where it crossed the legal limit. The model receives information from the world, but it does not send orders back to the world. This is the level where ecbyts operates today.
- The dashboard wired to sensors (digital twin). Here the path runs both ways and never stops: sensors installed in the field send measurements every second, the model follows in near real time, predicts how the contamination will behave and can trigger a response. That requires permanent equipment on site, constant calibration and a dense data history — without those, the prediction does not hold up.
The technical terms, explained as if to a neighbour
- Soil and rock types (lithology). This is what lies beneath the surface: clay, sand, rock. Some act like a sponge and hold water; others act as a barrier or as a channel where water runs faster. Knowing this is knowing where the contamination tends to go.
- Contamination patch (plume). The underground patch of substances that spreads together with the water beneath the ground. It does not stay where the leak happened: it travels in the direction of the groundwater flow.
- Estimating between points (interpolation). Picture two measured wells, one hundred metres apart. What lies in between? Nobody measured it. Estimating between points is the calculation that links one point to the other to draw the likely size of the patch. It is a smart estimate of the empty space between two measured points — and the model honestly shows where measurements are missing instead of pretending to be certain.
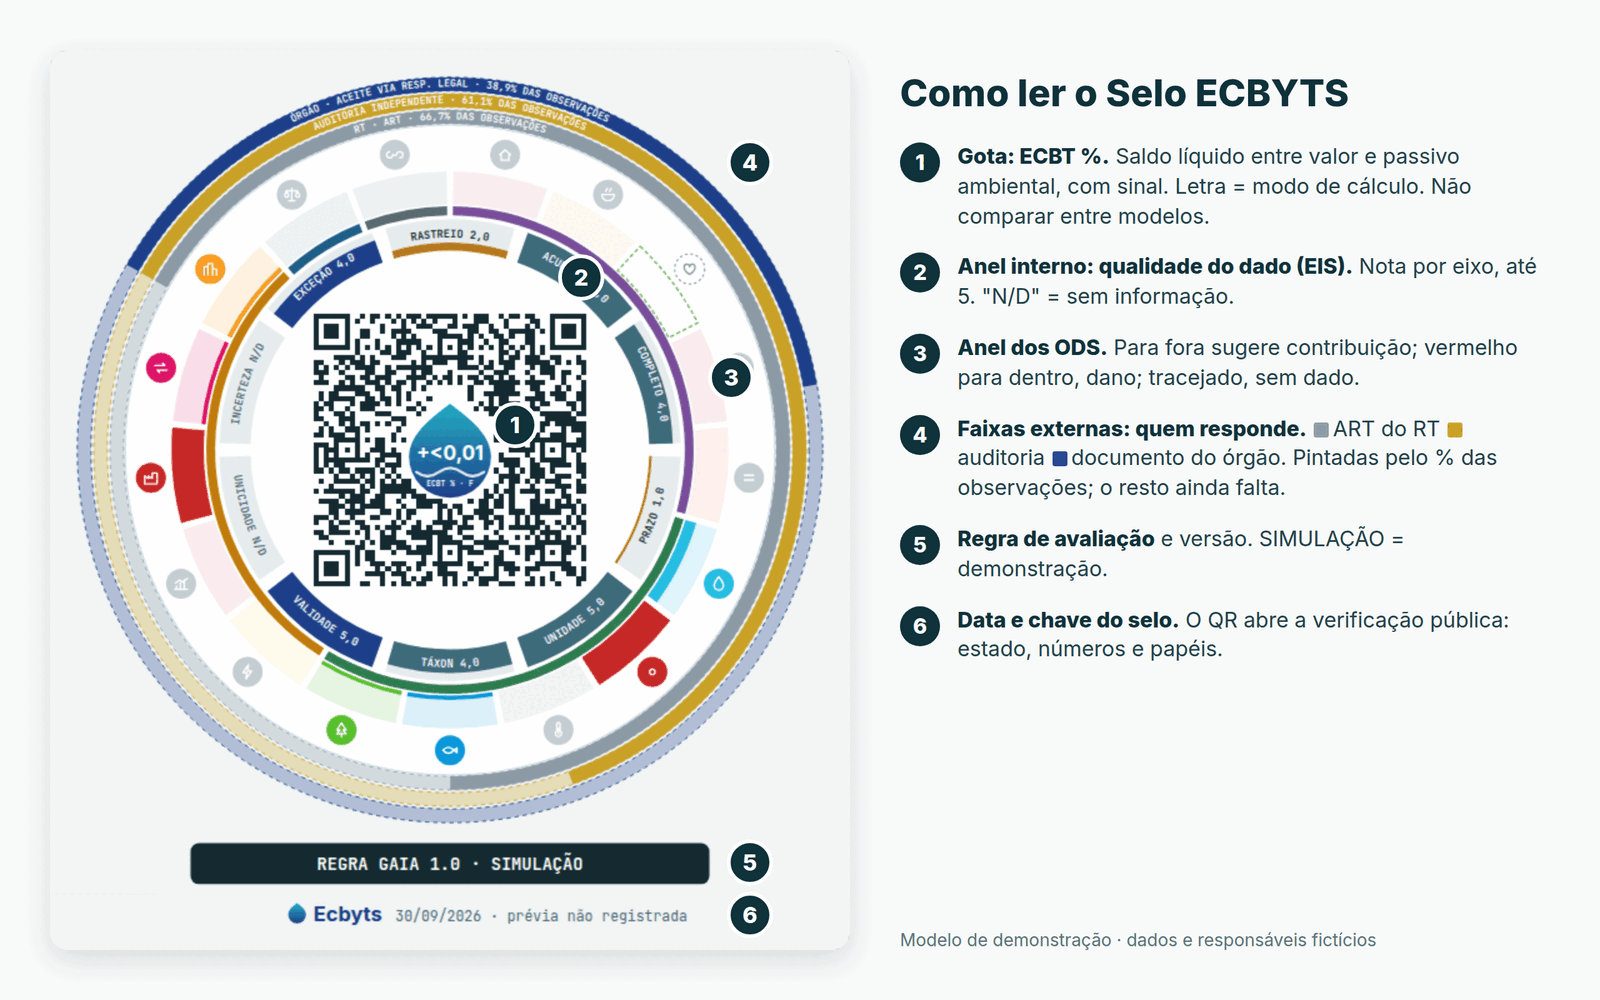
- Environmental balance as a percentage (ECBT %). A thermometer for the balance: on one side the environmental value of the site, on the other the cost of cleaning up the problem. The number shows which way the scales are tipping. Positive when the value is greater than the clean-up cost; negative when it is the other way round.
- Data reliability score (EIS). A score from 0 to 5 for the quality of the information: whether the data is complete, whether it is on time, whether the unit of measurement is consistent, whether the record shows who wrote it down and when. When information is missing, that axis appears as "N/D" instead of receiving an invented score. The app would rather warn that information is missing than hide the gap.
- Legal limits (CONAMA 420 and CETESB). The reference values published by the environmental authority. In everyday terms: one value says what already exists naturally in the soil, another switches on the amber light and tells you to keep watching, and the third forces an investigation once it is exceeded. CETESB publishes the values that apply in the state of São Paulo. The app compares the measured result with those limits automatically; what it does not do is deliver the verdict in place of people.
Where ecbyts stands today. ecbyts operates at the second level, and says so explicitly: a structured model fed by chained campaigns — every measurement with a date, a sample type, a method and an owner, and the history preserving what was known at each moment. What the app computes is the estimate between measured points (the standard techniques are called IDW and kriging) and the comparison of historical series across campaigns. It does not receive sensor readings every second and it does not predict the chemical behaviour of the contamination in three dimensions. Calling that a real-time twin would be selling the third level while delivering the second — and that boundary is exactly what decides what may be claimed.
The gain at the level we are on is not predicting the future: it is not losing the past and not confusing one campaign with the next.
How ecbyts organizes the twin
ecbyts does not store loose drawings. It stores an organized model in which every object has a name, a shape, a date and a role in the calculation.
Element families
Instead of scattered layers, each object belongs to a family: site and project, monitoring wells, soil sampling points, surface water and groundwater points, soil and rock types and aquifers, contamination patches, structures, legal limits and restriction areas. Register once, use it in every calculation. When a new well is installed it is not just one more file: it becomes an element with its own history, and every calculation that depends on it updates.
Dated observations
Every measurement enters as an observation: value, unit, date, sample type, method, source and owner. Nothing is deleted or overwritten. A new campaign produces new observations, and the old ones remain — that is what builds the history. The twin does not swap the previous truth for the latest one: it shows the evolution and lets you ask what was known at each moment.
Editing during analysis and immutability on sealing
While the model is open for editing it is mutable on purpose: the user creates, corrects and deletes elements and observations freely, and none of it is final. The immutable part is not a quality of a file sitting still; it is an act. It begins when the work is closed: when the model file is exported or an ECBYTS Seal is issued, the content is sealed — like a notary's wax seal that cracks if someone changes a single comma. Each version then carries a mathematical fingerprint of the previous one (specialists call that fingerprint a hash), forming a sequence in which touching an old version breaks the check.
That separation is what allows working without fear of mistakes and, at the same time, defending what was delivered: the analysis stays free while it is analysis; the record that comes out of it does not.
Estimating between points in space and in time
Between two measured points, the model estimates what lies in between. Between two campaigns, it estimates the trend. Making that estimate means assuming that the middle of the path resembles its edges — and every assumption has limits. So the model shows where it knows little: a region with three wells and a region with thirty do not receive the same degree of confidence, and the difference stays visible instead of hiding behind a uniform colour.
Balance and quality: ECBT % and EIS
Two readings follow the model at all times:
- ECBT % is the balance between the environmental value and the cost of cleaning up the problem estimated for the model, expressed as a percentage of a comparison base. The sign shows which way the balance tips: positive when the value exceeds the clean-up cost, negative otherwise.
- EIS is the reliability score for the information, measured across axes such as the accuracy of the values, completeness, timeliness, unit of measurement, identification of the species analysed, validity and the trace of who registered it, on a scale up to 5. An axis without enough information appears as "N/D" instead of receiving a score.
Both numbers are recalculated with every new data point. And both are internal reading indicators, not a verdict: the ECBT % base can still vary from one model to another, and EIS comes from indirect signals such as coordinates, campaigns and the identification of whoever registered the data — it does not replace the laboratory's own quality control of the analysis.
Legal limits compared at the point
The same model carries the limits that apply to that site: CONAMA Resolution 420, with its reference, prevention and investigation values; CETESB's guiding values and decisions for the state of São Paulo; and the references of the US environmental agency (EPA) used in risk assessment. The comparison is automatic; the interpretation is not. Exceeding an investigation value opens an obligation to investigate, it does not close a diagnosis of harm. The Technical Responsible professional still signs that reading, and the environmental authority still decides the legal classification.
Two questions, two audiences
For the field engineer
The twin answers where to sample again, which well has an interrupted history, which point sits above a limit and since when. It brings together what today lives apart: the map, the lab spreadsheet, the campaign history and the applicable legal rule. A spreadsheet does not cross yesterday's result with the water level measured three years ago. The twin does.
For the finance director
The cost of cleaning up a contaminated site is a number that enters the balance sheet, and a balance-sheet number needs support. The twin allows you to estimate the size of that cost and to test remediation scenarios before drilling or spending: active remediation, monitored natural attenuation, containment. Each scenario carries an estimated volume, a schedule, a cost curve and an effect on the balance. What the model compares are estimates resting on the campaigns that already exist — not a calibrated simulator of the chemical behaviour of the contamination, which would require the third level. Testing a scenario in the model costs almost nothing; testing it in the field is expensive and slow. Deciding with the scenario already simulated is different from deciding on the promise of a number.
What a digital twin does not do
- it does not replace field sampling: without a sample, the model has nothing to estimate;
- it does not replace the laboratory report or the quality control of the analysis;
- it does not issue a legal opinion and does not speak for the environmental authority;
- it does not turn bad data into good data: it exposes where the information is weak instead of disguising it;
- it is not a real-time sensor dashboard and not a prediction of the chemical behaviour of the contamination: the current regime is campaign-based, with estimates between measured points and comparison across historical series — what the model projects is the trend between campaigns, not the reactive path of the patch;
- it is not an accounting provision (the standards that deal with this are CPC 25 and IAS 37) and not a guarantee of remediation outcome;
- it decides nothing on its own: it organizes the evidence and leaves uncertainty in plain sight for whoever decides.
The real gain is not automatic correctness. It is not losing data between loose spreadsheets, not hiding uncertainty behind a round number, and not discovering on the eve of a hearing that the decisive information sat in a file nobody opened.
See it in practice
The interactive tour runs on a demonstration model and shows the twin at work: element families, dated observations, contamination patches, historical series, balance and information quality.
Open the interactive Environmental Digital Twin tour on ecbyts
For those working in site investigation, remediation or permitting: what information usually gets lost between the field campaign and the final decision?